imshow_norm
-
astropy.visualization.mpl_normalize.imshow_norm(data, ax=None, imshow_only_kwargs={}, **kwargs)[source]¶ A convenience function to call matplotlib’s
matplotlib.pyplot.imshowfunction, using anImageNormalizeobject as the normalization.- Parameters
- data2D or 3D array_like - see
imshow The data to show. Can be whatever
imshowandImageNormalizeboth accept.- axNone or
Axes, optional If None, use pyplot’s imshow. Otherwise, calls
imshowmethod of the supplied axes.- imshow_only_kwargsdict, optional
Deprecated since Astropy v4.1. Note that settting both
normandvmin/vmaxis deprecated inmatplotlib >= 3.3.Arguments to be passed directly to
imshowwithout first tryingImageNormalize. This is only for keywords that have the same name in bothImageNormalizeandimshow- if you want to set theimshowkeywords only, supply them in this dictionary.- kwargsdict, optional
All other keyword arguments are parsed first by the
ImageNormalizeinitializer, then toimshow.
- data2D or 3D array_like - see
- Returns
- resulttuple
A tuple containing the
AxesImagegenerated byimshowas well as theImageNormalizeinstance.
Notes
The
normmatplotlib keyword is not supported.Examples
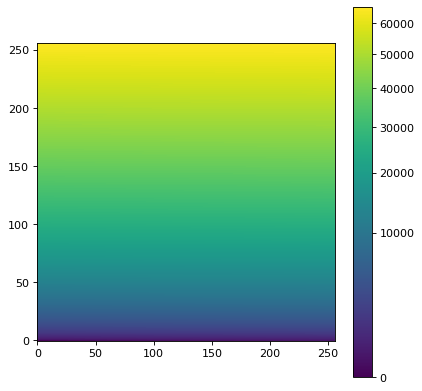
import numpy as np
import matplotlib.pyplot as plt
from astropy.visualization import (imshow_norm, MinMaxInterval,
                                   SqrtStretch)

# Generate and display a test image
image = np.arange(65536).reshape((256, 256))
fig = plt.figure()
ax = fig.add_subplot(1, 1, 1)
im, norm = imshow_norm(image, ax, origin='lower',
                       interval=MinMaxInterval(),
                       stretch=SqrtStretch())
fig.colorbar(im)
